The Photometry tool provides highly accurate photometric measurements, and allows for the plotting of light curves. A detailed explanation of photometry is beyond the scope of this manual. A good place to start for further research is the American Association of Variable Star Observers, http://www.aavso.org.
The accuracy of the photometric tool is higher than that of the Information window display. It uses a ”median-mean” algorithm for background subtraction. It also takes into account partial pixels inside the measurement annulus.
The size of the measurement annulus is determined using the right-click context menu for the circular cursor. Right-click on an image to bring it up. Please see the description under Information Window for more details.
This command only works with monochrome images. Although color cameras are not recommended for photometry, it is possible to use the Color menu Convert To Mono command to convert the images prior to analysis.
Availability of this feature depends on Product Level.
Quick Start Guide
The Photometry tool works similarly to the Stack command, so the interface should feel familiar if you have previously stacked images in MaxIm DL.
First set up your calibration frames, if used (recommended), using the Set Calibration command.
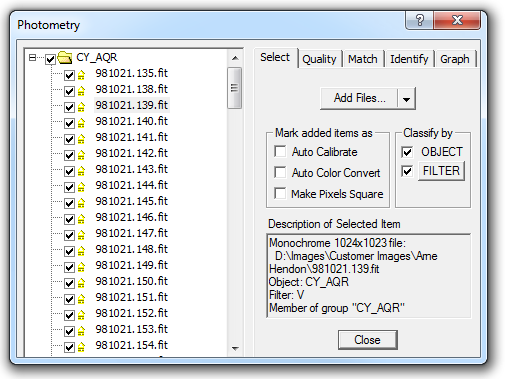
First, on the Select Tab. Make sure Auto Calibrate is checked. Also make sure Classify by OBJECT and Classify by FILTER are checked; this will ensure FITS header data is used for sorting the images.
Next click Add Files (use the drop arrow if needed to select the Add mode). Browse to your files, select them, and click OK.

If the object name does not automatically appear (taken from FITS header), right click on the group at the top and select Set Object. Note that you can analyze more than one object, and more than one color band for each object, at the same time.
For now, leave all check boxes turned off in the Quality tab.
In the Match tab, set Mode to Auto Star Matching or Astrometric (per your preference). Choosing either of these settings allows MaxIm DL to automatically identify the same stars in each image, which makes the job of tagging them much easier.
Now switch to the Identify tab. Click on one of the images in the list, and it will be displayed automatically. Find the variable star in your image and right-click on it, and select Tag New Object. Type an ID for it (usually the variable name); this is the name that will appear on the graph and the reports.
Next right-click on your comparison star and click Tag New Reference Star. If you have more than one filter set, then a dialog box will pop up to allow you to enter the reference magnitude in each plane. Otherwise you can simply enter it into the table.
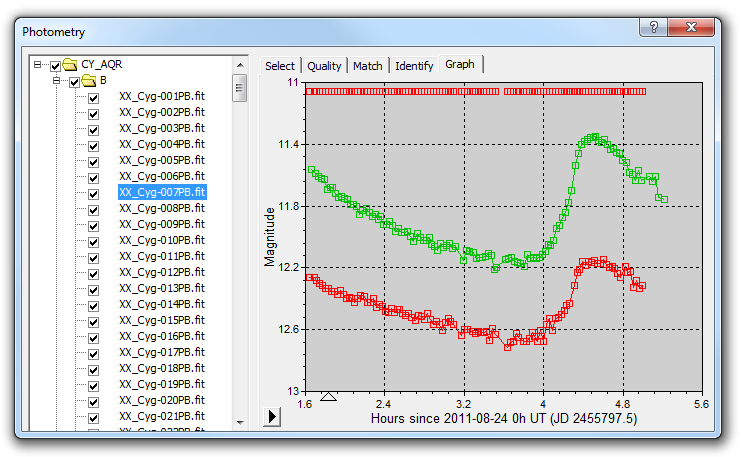
Next click on the Graph tab. The images will be analyzed and the data presented.

From here you can format the graphs, remove bad images, export data, print, etc. For full details please see the following sections.