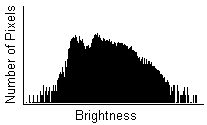
To better understand the more complex stretching techniques, it is helpful to understand histograms. A histogram is a simple bar graph that shows the range of brightness in an image. Each bar in the graph represents a range of brightness; the first bar represents the dimmest pixels, and the last bar is for the brightest pixels. The height of the bar is the total number of pixels in that brightness range in the image. Every image has a different histogram depending on how much of the image is bright or dark.

Typical Histogram
A typical histogram will have a peak that shows the most common brightness in the image. For astronomical images this is often the sky background. A part of the histogram where there is a dip reveals that few pixels have brightness in that range. When stretching, we do not want to emphasize those areas because they contain little information.
Any stretching operation can be viewed as reshaping the histogram. Some functions do this in a fixed manner; others actually force the histogram to have a particular shape. Both types of techniques will be described below.