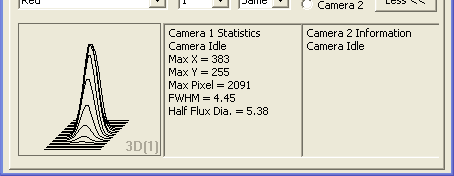
The Inspect panel is used to monitor the status of the cameras. There are three panels; one graphical panel, and two text panels. Each can be configured to display different information by right-clicking on them. Different information can be displayed in the panels depending on which Tab is selected in the upper part of the window. You can, for example, display guider status information when the Guide Tab is showing, and main camera information when the Expose Tab is showing.
The inspect panel can also be hidden, to save screen real estate, by clicking the Less << button. The button then switches to display More >>, and clicking the button will display the Inspect panel once again.

The graphical panel has a simple right-click menu for configuring the display. The first group allows you to select the camera to display:
Camera 1 sets the display to Camera 1.
Camera 2 sets the display to Camera 2.
The second group allows you to choose the graphical display:
Brightest Star, 3D displays a 3D plot of the brightest star in the field. This can give you an idea of the focus quality.
Brightest Star/time displays a plot of the star brightness over time. The graph is updated each time an exposure is taken. This can be useful for focus, and is also very useful as a sky transparency monitor. If you see the graph start to dip, you may suspect that the conditions are degrading.
FWHM/time displays a plot of the Full Width Half Maximum (FWHM) over time. This is an indication of the diameter of the star, which is in turn a measure of the focus and seeing. FWHM is calculated by fitting a Gaussian profile to the star image, then calculating the diameter at which the Gaussian falls to 1/2 the peak height.
HFD/time displays a plot of the Half Flux Diameter (HFD) over time. HFD is similar to FWHM, but measures the parameter in a completely different way. The HFD is the diameter at which half the flux of the star image falls inside the circle, and half falls outside. HFD is more robust when the star is far from focus, and will work well even if you have a "donut".
SNR/time displays the calculated signal-to-noise ratio for the brightest star over time.
Reset Graph will appear only if you are displaying a graph that updates over time. This allows you to clear the graph, e.g. for purging a previous focus session.
The two text panes can be set up independently. Each has an identical right-click menu that allows you to configure the display and perform some clipboard operations:
Camera 1 Info shows the camera state, exposure time and elapsed time, cooler state, sensor temperature, temperature setpoint, autosave image number, index of image in autosave sequence, and elapsed and predicted time for exposure autosave sequences.
Camera 2 Info shows the same information for Camera 2.
Camera 1 Stats shows statistics including location of the brightest pixel in X and Y, maximum pixel value, Full-width Half Maximum (FWHM) of brightest star, Half Flux Diameter (HFD) of the brightest star, and Signal-to-Noise Ratio (SNR) of the brightest star.
Camera 2 Stats shows the same information for Camera 2.
Coolers shows the status of the sensor coolers in both Camera 1 and Camera 2.
Copy makes a copy of any selected text on the clipboard. You can select text using the mouse.
Select All selects all the text in the pane.
Tip: The displays are for the brightest star in the image. If you would like to pick a specific star, set up a Subframe on the Expose Tab.
Tip: For a window showing a large-text view of the text information, go to the Expose Tab Options menu and select Display Large Statistics.
Tip: The Information Window can also display FWHM. It allows you to select the star to measure, and it can be optionally set to give the measurement in arc-second units. The Inspect window is better for rapidly measuring a series of images of the same star, whereas the Information window can be used to inspect various stars on the same image.