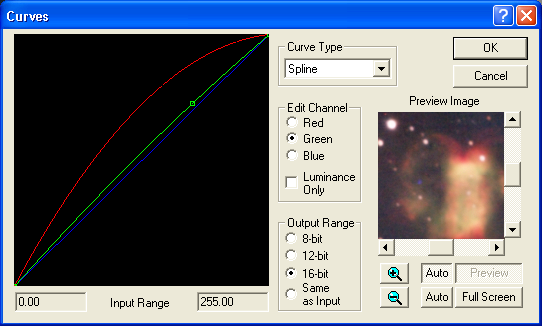
For an introduction to this command please see Enhancing Details with Curves Tutorial.

This command allows you to specify a transfer curve for the image. The line graph is a mathematical transfer function with input along the horizontal axis and output along the vertical axis. A straight line from bottom-left to top right corner has no effect on the image.
Clicking on the graph area places control points which describe the curve. The effect of these points depends on the Curve Type setting. When Piecewise Linear is selected, MaxIm DL generates a curve by drawing straight lines between each of the control points. When Spline is selected, a smooth curve is generated that is guaranteed to pass through each of the control points. Selecting Modified Spline is the same as selecting Spline, except that MaxIm DL automatically adds additional points to the curve to smooth it out still further. Certain combinations of control points can produce curves with unexpected characteristics when using the Spline function, but this problem can often be corrected just by switching to the Modified Spline function.
The curve shown in the diagram is similar to applying a gamma function to the image. More complex curves are possible; you can create a very non-linear mapping between the input levels and the output levels.
For color images the Edit Channel selectors will be available. You can adjust the overall luminance by selecting Luminance Only, or tweak the three color planes individually. When Luminance Only is off, the transfer graph shows three lines, one for each color. Select Red, Green, or Blue to edit the transfer graph for that color plane.
When editing the line, you can right-click on the graph to bring up a menu. If the image is monochrome, you are always working in monochrome mode, and the right-hand pane of the menu will not be displayed. If the image is color, then the right-hand pane is displayed, and is used to select the color plane that will be modified when you click on the graph. Clicking R, G, B or Mono is equivalent to clicking on the Red, Green, Blue or Luminance Only controls in the Edit Channel group box. Insert a point inserts a point, just like left-clicking the graph. The Delete a point option is only available if you right click on a point that's already been created; selecting it deletes the point. Select Same As and a further popup menu appears. Selecting the items R, G, B on the popup will change the curve for the current plane to match the clicked one.
Curve also brings up a submenu. Reset resets the curve to a straight line; for an RGB curve, only the currently selected color channel is affected. The next four entries manage a library of curve shapes: Load selects a previously saved curve from those compatible with the current image; Save saves the current curve as either a new entry or replacing an existing one; and Delete removes a saved curve from the library altogether. All three commands display a dialog-based droplist (editable in the case of Save) to specify the curve name. Import creates a precision curve from a disk file containing numerical values to specify the curve. The input file is relatively free format with two to four values specified on each line, separated by commas. The first number is the X coordinate, between 0 and 65535, while the remaining values are multipliers for the R, G, and B channels at this point. If every input line has only two fields, the curve is considered monochrome/Luminance Only. Data must be supplied in increasing order by X coordinate. The first and last lines should specify the multipliers at X=0 and X=65535 respectively; for color curves, all three colors' multipliers should be given. After importing the data file, a Save command is activated automatically to allow you to name the curve.
Precision curves are always interpolated by the Piecewise Linear method and assume fixed input and output ranges. They cannot be directly edited by the user interface; therefore most controls, including Insert and Delete, are disabled when one has been loaded. However, the Unlock command will convert one to an ordinary graph-based curve capable of being edited using the mouse.
The Input range for the transfer function is the minimum and maximum pixel value in the image, and is displayed just beneath the graph. The Output range is user-specified. The available choices are 8-bit (the output range is 0-255), 12-bit (range is 0-4095), 16-bit (range is 0-65535) or Same as input, in which case the transfer function produces an output image with the same minimum and maximum intensity as the input.